
In this month, we look at the performance of export credit in FY24 and its diminishing role. We extend our investigation into the Red Sea impact on India’s trade to pick up early signals. This is followed by a quick assessment of US and India’s monetary policy along with the outlook on the Indian rupee.
1. Diminishing role of export credit
Export credit registered its second consecutive contraction (-30% and -37% in 2022-23 and 2023-24 respectively), with the magnitude of outstanding credit slipping to Rs 12,900 cr for the year ending Mar-24. In value terms, this is the lowest level of export credit in last 17-years. More importantly, we note that the importance of export credit has been slipping over the years:
- In 2023-24, the share of export credit in total bank credit slipped to a record low level of 0.08%.
- The ratio of export credit to merchandise credit has fallen from its peak of 3.8% in 2007-08 to 0.4% in 2023-24.
Chart 1: Role of export credit in trade financing has diminished considerably
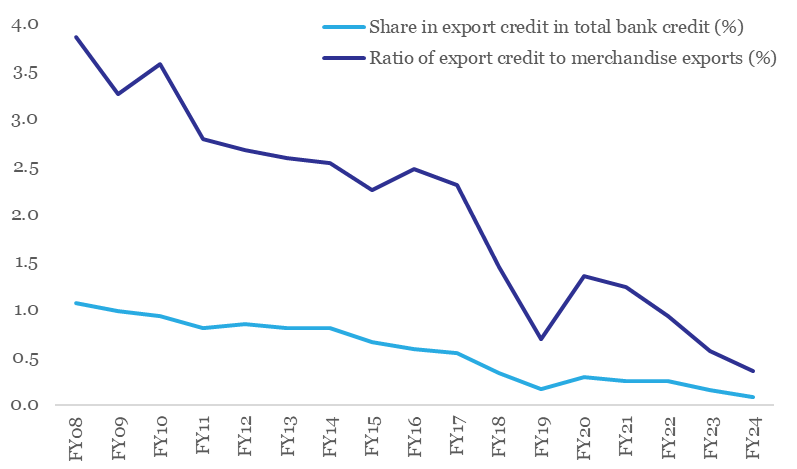
Source: RBI, CEIC, QuantEco Research
At a cursory level, we note that while India’s market share in global exports has improved since 2007-08 to its record high levels of 1.8-1.9% in 2023-24, the economy’s export intensity (captured by the ratio of merchandise exports to GDP) has moderated to 12.2% in 2023-24, which is marginally below its pre COVID levels of 12.5%, but significantly lower than its peak performance of 17.0% in 2011-12. The trend of improving market share coupled with reducing export intensity (on the merchandise side) is intriguing and needs to be researched and investigated in detail by the policymakers.
A reduction in export intensity at an economy wide level translates into a lower requirement for export credit. Having said, it is also possible that alternatives to bank-based export credit are now readily being availed by exporters.
Chart 2: India’s export intensity has reduced even though its’s export market share has improved
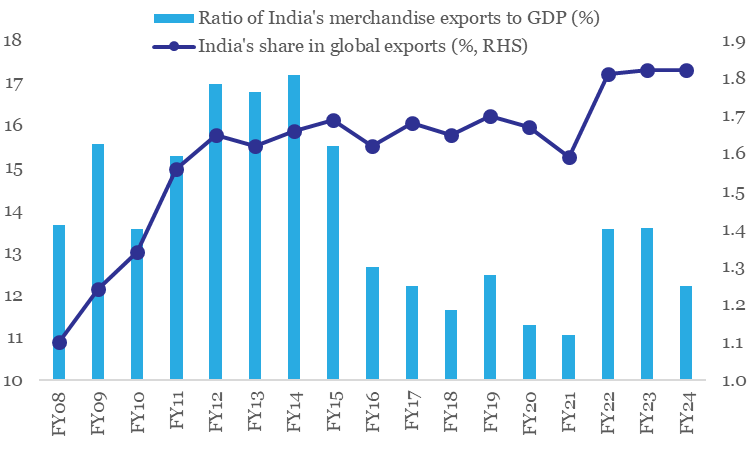
Note: Data for FY24 refers to the period Apr-Dec 2023
Source: RBI, WTO, CEIC, QuantEco Research
2. Is there any evidence of Red Sea impact on India’s merchandise exports?
Notwithstanding the ongoing disruption to global merchandise trade on account of geopolitical conflict in the Middle East region, India’s export performance has held up with annualized growth in merchandise exports improving to 2.9% in Jan-Mar FY24 over Oct-Dec FY24. This could be reflective of the impact of higher international commodity prices along with resilience in global demand (highlighted in our last month’s issue).
Since the start of the Red Sea disturbance in Dec-23, the underlying sequential momentum in India’s merchandise trade over Jan-Apr 2024 period has shown a mixed trend, with 2 out of 4 months exceeding the seasonal sequential benchmark, and vice versa (see table below). This points towards lack of any conclusive evidence of an adverse impact of recent geopolitical disturbances.
Table 1: Headline exports does not show any conclusive evidence of sub-par performance post the Red Sea disturbance
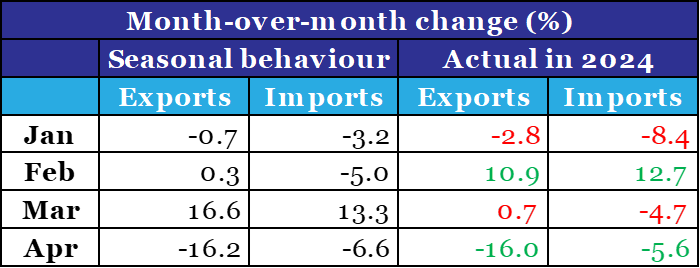
Note: (i) Month-over-month change is on the $ value of exports; (ii) Seasonal behaviour represents last 30Y median
Source: India’s Commerce Ministry, CEIC, QuantEco Research
A cursory look at India’s export destinations that exhibited weakness in the post Red Sea period (defined as more than 10 percentage point slide in annualized export performance in Jan-Mar FY24 over Oct-Dec FY24) indicates no conclusive evidence of systematic disruption – the geographical distribution of such export destination appears to be well spread.
Chart 3: Decline in demand India’s exports post the Red Sea disturbance shows a mixed geographical distribution
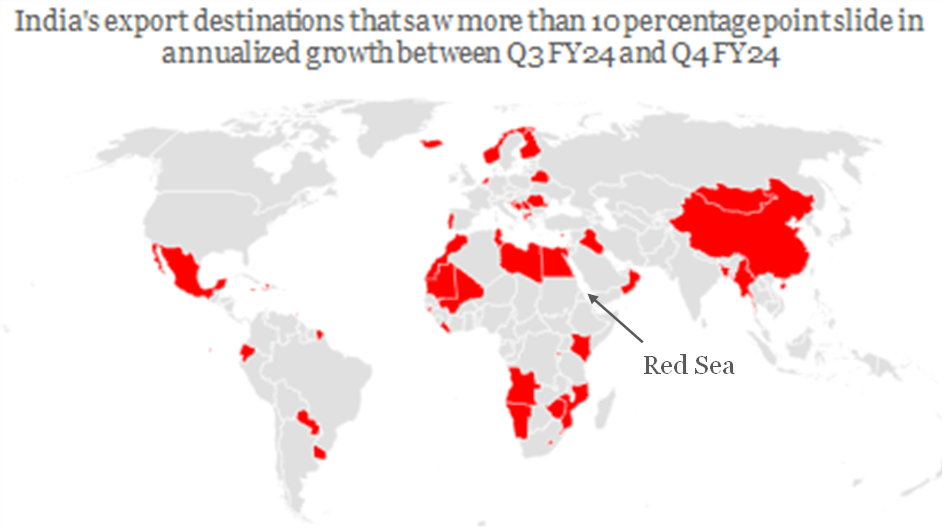
Source: India’s Commerce Ministry, CEIC, QuantEco Research
Having said, we note that the threat of Red Sea disruption remains alive. As per the FIEO (Federation of Indian Exporters’ Organisations), “delays and higher costs of shipping can lead to more order cancellations and hurt India’s competitive edge in global markets”. We would continue to track data in this space to arrive at early signals.
Table 1: Europe-Asia trade is the worst affected on account of Red Sea disturbance
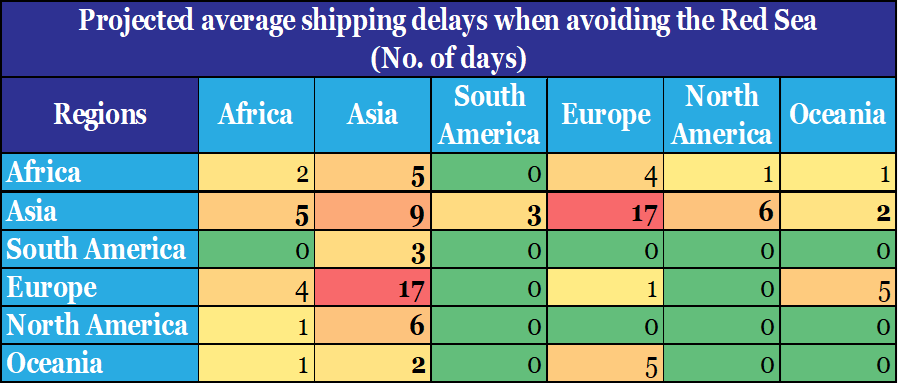
Source: WTO, QuantEco Research
3. Monetary Policy: Easing by the US Fed to get delayed
Market expectations regarding Fed’s monetary policy trajectory remains on tenterhooks and is seen to be swaying with every notable surprise in key US economic data. Continued resilience in US activity data coupled with stickiness in inflation has already led to a significant pruning of market expectations of rate cuts from the Fed – the current pricing by futures market suggests likelihood of 1-2 rate cuts before the end of 2024, down from the expectation of 5-6 rate cuts at the beginning of the year.
This pushback in the anticipated rate easing in US could have an impact on other emerging market economies, like India. A surplus rainfall projected for the 2024 south-west monsoon season is preceded by (ongoing) severe heatwave conditions across India in Apr-Jun, that could cause some volatility in food price pressures in the near term. We expect the RBI to start easing monetary policy from Oct-24 onwards, with likelihood of a cumulative 50 bps rate cut by Mar-25.
Chart 4: Market participants expect 1-2 rate cuts from the US Fed in 2024
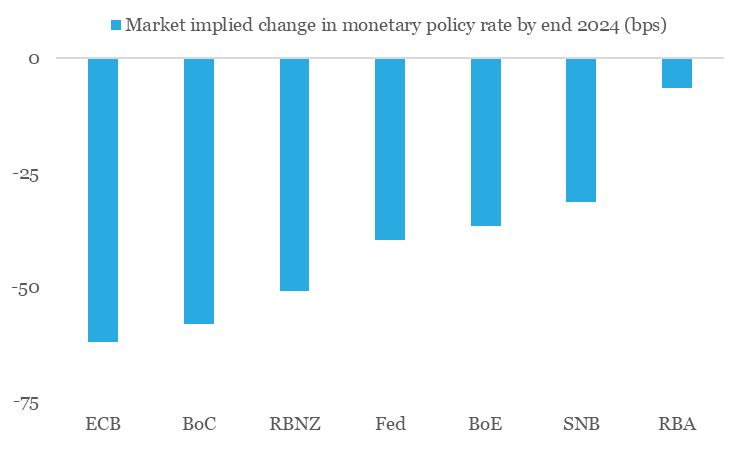
Source: Refinitiv, QuantEco Research
4. Rupee view
Notwithstanding gyrations in the global currency markets in last 1-2 months, the Indian rupee kickstarted the new financial year 2024-25 on a firm footing vs. the USD. Although the general election cycle is currently underway, we believe the overall policy backdrop of macroeconomic stability is likely to prevail in near-to-medium term. While this would continue to provide a stable underpinning to the INR, global factors like uncertainty around the US monetary policy trajectory and geopolitical risks could result in bouts of depreciation pressure. Overall, INR’s 6-7% overvaluation, and RBI’s penchant for reserve accumulation would tilt the balance in favor of a mild depreciation. We maintain our call of USDINR moving towards 84.50 levels by Mar-25 vs. FY24 close of 83.43.
5. CYTD price change in key commodity groups and shipping cost
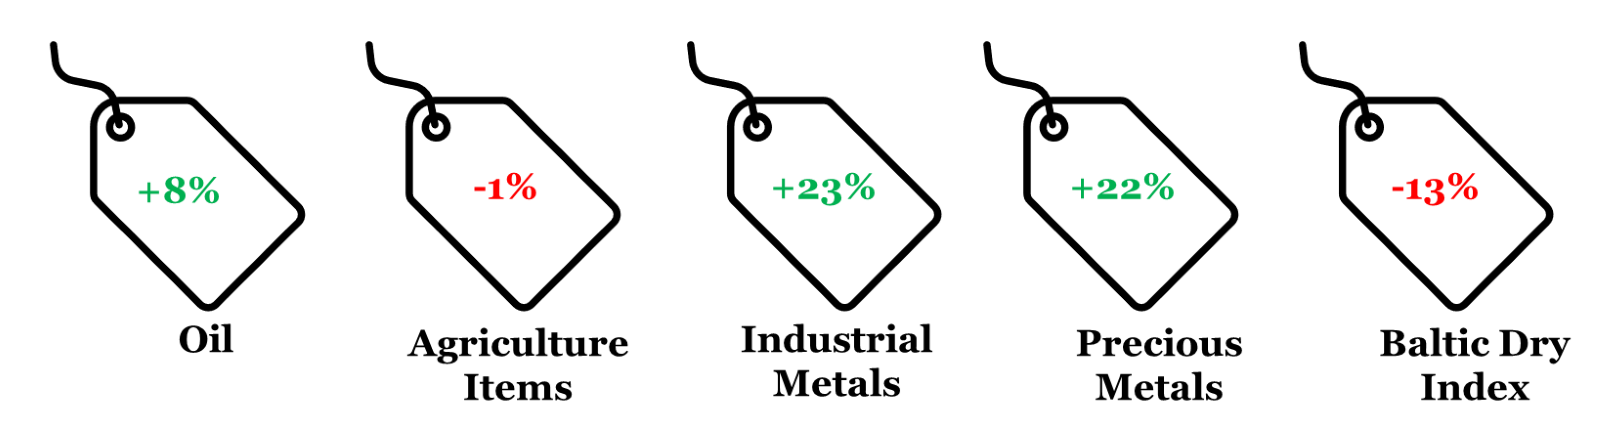
Note: (i) Price change is between May 21, 2024 and Dec 31, 2023; (ii) Oil price is represented by Brent; (iii) Agriculture Items, Industrial Metals, and Precious Metals are represented by respective Bloomberg Commodity indices; (iv) rounded off figures represented.
Data: Refinitiv, QuantEco Research