In this month, we look at the fragmentation of global merchandise trade, which would somewhat inhibit the extent of anticipated recovery in 2024. This is followed by a quick assessment of US and India’s monetary policy along with the outlook on the Indian rupee.
1. Global trade fragmentation
Notwithstanding the expectation of a moderate recovery in world merchandise trade in 2024 (which we elaborated upon in the May-24 newsletter), global trade activity has been continuously facing geopolitical headwinds. This trend that became noticeable with the start of US-China trade war in 2018 and picked up considerable momentum in the post COVID period, with many countries displaying protectionist tendencies. The calendar year 2023 saw a record number of harmful trade policy interventions by countries.
Chart 1: Trade protectionism has seen a sharp rise in last few years

Source: GTA, QuantEco Research
Since 2023, countries have used several motives to intervene on the merchandise trade front. The most common reasons cited are:
- Strategic competitiveness
- Climate change mitigation
- Resilience/ Security of supplies
- Geopolitical concern and national security
These trade policy interventions have given rise to both winners and losers across sectors. The table below lists Top 5 sectors under each category (since 2023).
| Sectors affected by liberalising interventions | No. of interventions since 2023 | Sectors affected by harmful interventions | No. of interventions since 2023 |
| Machinery & parts | 124 | Iron & steel and its products | 533 |
| Cereals | 70 | Cereals | 304 |
| Vegetable oils | 70 | Fabricated metal products | 276 |
| Sugar & molasses | 54 | Unfinished products of copper, nickel, aluminium, lead, zinc, or tin | 258 |
| Grain mill products | 52 | Glass and its products | 247 |
Source: GTA, QuantEco Research
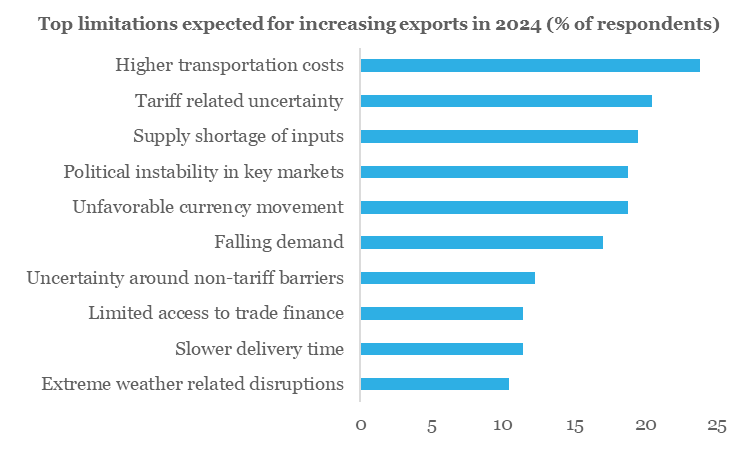
From 2024 perspective, the outlook on world merchandise trade (as enumerated by multilateral agencies like the IMF and the WTO) is moderately encouraging. Exporters surveyed by The Economist expect 2.3% increase in export volumes (goods + services) in 2024 compared to a subdued growth of 0.7% in 2023. Having said, the exporters echoed the uncertainty of the current global trade environment by highlighting veracious limitations for expansion (Top 10 limitations are illustrated below in Chart 2).
Chart 2: What’s limiting exporters’ ability to expand?

Source: Economist, QuantEco Research
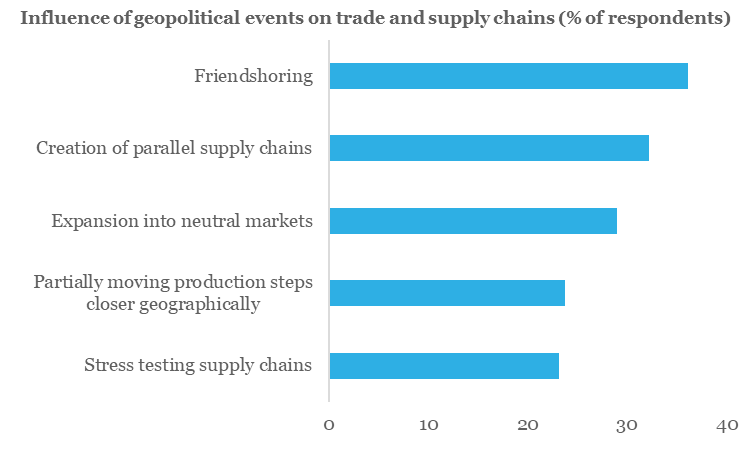
Interestingly, as a response to ongoing geopolitical shocks and in preparation for further escalation of geopolitical tensions that disrupt global trade, strategies like ‘friendshoring’ and the creation of dual supply chains are gaining prominence. The ‘China+1’ strategy is becoming more prevalent as businesses seek to diversify and reduce their dependency on a single region.
Chart 3: How are geopolitical events impacting global trade and supply-chains?

Source: Economist, QuantEco Research
2. Monetary Policy: Easing by the US Fed to get delayed
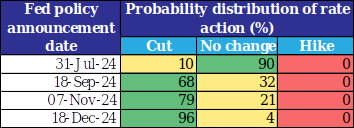
Along expected lines, the US Federal Reserve once again pushed back monetary easing expectations at its Jun-24 policy review. As per the latest projections by the Fed members, there is likely to be one rate cut before the end of 2024, down from the projection of two rate cuts predicted earlier in Mar-24.
While the pushback in the anticipated rate easing in US could have an impact on other emerging market economies, few central banks (like the central banks in Eurozone, Canada, Switzerland, Sweden, Brazil, Mexico, etc.) have taken the lead in kickstarting their monetary easing cycle. This highlights the importance of domestic macroeconomic conditions guiding central bank actions.
In case of India, we believe the RBI will also follow its own course and wait for food price volatility to subside after the completion of the 2024 south-west monsoon season (in which the Indian Meteorological Department projects a 6% surplus rainfall). A favorable monsoon outturn and range-bound commodity prices will enable to start easing monetary policy from Oct-24 onwards, with likelihood of a cumulative 50 bps rate cut by Mar-25.
Chart 4: Market participants expect 1-2 rate cuts from the US Fed in 2024

Source: Refinitiv, QuantEco Research
3. Rupee view
Notwithstanding gyrations in the global currency markets in last 2 months, the Indian rupee kickstarted the new financial year 2024-25 on a firm footing vs. the USD. With election uncertainty now behind, investors can now look forward to political and policy continuity. We expect the new government to continue prioritizing macroeconomic stability with focus on inclusive development.
From a flow perspective, INR is likely to remain in a comfortable zone:
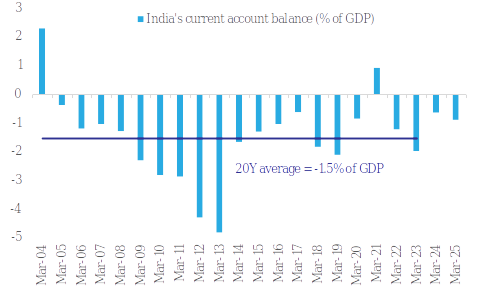
- India’s current account deficit narrowed to 0.7% of GDP in FY24 (the lowest in the post COVID phase) from 2.0% in FY23. After adjusting for capital flows, the accompanying balance of payment registered a strong surplus of USD 64 bn in FY24.
- For FY25, we expect current account deficit to show a mild increase to 0.9% of GDP (though much lower than the long-term trend of 1.5%). However, expectation of recovery in FDI flows along with healthy FPI flows (amidst India’s inclusion in global bond indices) should help to generate a healthy BoP surplus of USD 50 bn.
Chart 5: India’s FY24 current account deficit was narrower than its long term trend; likely to remain so in FY25

Source: CEIC, QuantEco Research
Meanwhile, global factors like uncertainty around the US monetary policy trajectory and geopolitical risks could result in bouts of depreciation pressure. Overall, INR’s 6-7% overvaluation, and RBI’s penchant for reserve accumulation would tilt the balance in favor of a mild depreciation. We maintain our call of USDINR moving towards 84.50 levels by Mar-25 vs. FY24 close of 83.43.
5. CYTD price change in key commodity groups and shipping cost

Note: (i) Price change is between Jun 24, 2024 and Dec 31, 2023; (ii) Oil price is represented by Brent; (iii) Agriculture Items, Industrial Metals, and Precious Metals are represented by respective Bloomberg Commodity indices; (iv) rounded off figures represented.
Data: Refinitiv, QuantEco Research
